LEVEL: 300 – This quick article assumes that you already have at least one (1) year full time experience with Power BI and are efficient at creating datasets, dashboards, and visuals.
Today I want to create a Power BI dashboard that will work like my SSRS report for the SQL Performance Monitor solution we created in an earlier series.
Series link: https://lovethesql.com/sql-performance-monitor-part-1-overview/
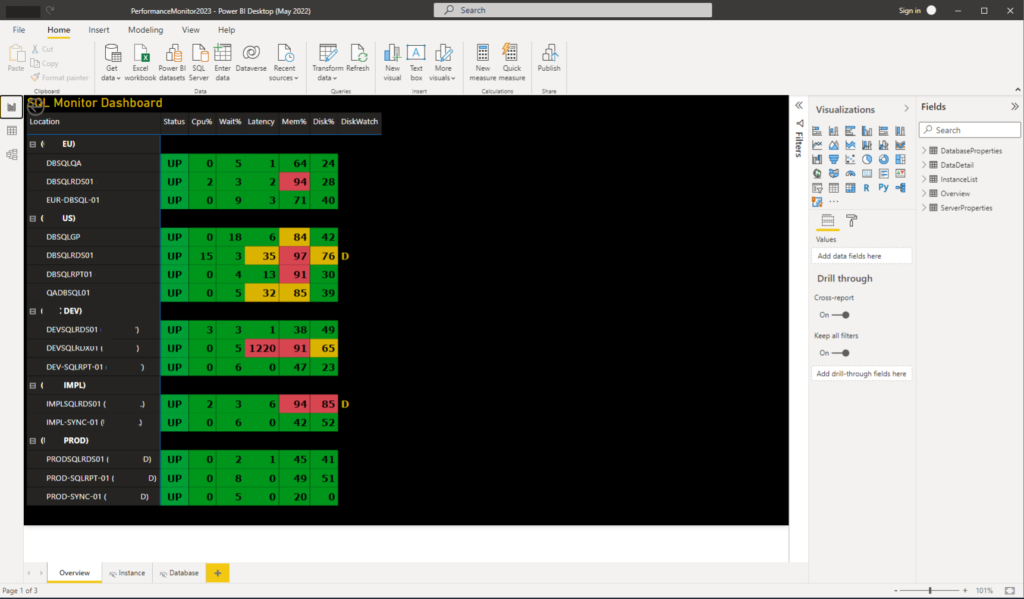
The final dashboard will look something like this:
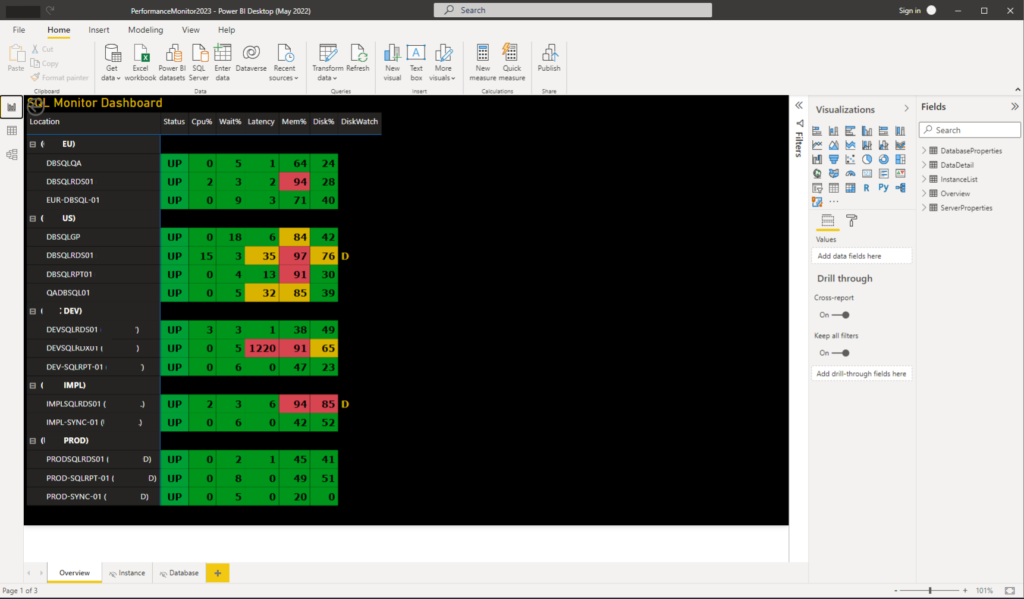
Keeping in mind that I have an on-premises server running SQL Server 2019 Enterprise. I want to keep my datasets as small as possible, but I want to be able to view at least the data from all of today and maybe a few summaries that go further back.
To accomplish this, I will first create some queries, views, and stored procedures. I want to create a Summary Dashboard with the ability to drill through to get server and database information on the instance.
Data Source
I will be using DATASOURCES with the IMPORT Connectivity Mode to retrieve data.
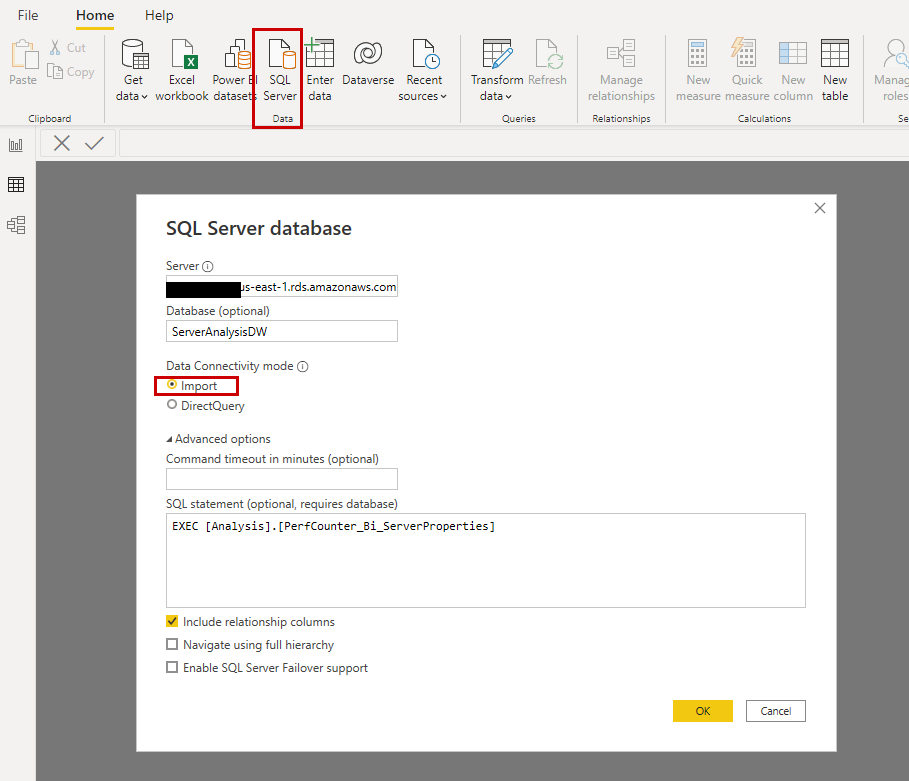
I will be pulling from views and procedures that were created in the previous project and/or uploaded to GIT for that solution at: GITHUB.
Additionally, I will need to create these new views and stored procedures:
USE [ServerAnalysisDW]
GO

CREATE  VIEW [Analysis].[pcv_bi_overview_today]
AS

SELECT L.LocationID, L.ClusterID, L.ClusterName,
CONCAT(ClusterName,' (',
(CASE L.LocationID	WHEN 101123 THEN 'MyCompany-US'
			WHEN 201123 THEN 'MyCompany-QA'
			WHEN 301123 THEN 'MyCompany-DEV'
			ELSE 'Undefined' END)    ,')') AS ClusterFullName,
			t.Time4s,
	MAX(cpu.iValResult) AS CpuPercent,
	MAX(sig.SignalWaits) AS SignalWaits,
	MAX(lat.DiscLatencyMs) AS DiscLatencyMs,
	MAX(mem.MemoryInstPercentInUse) AS MemoryInstPercentInUse,
	MAX(du.DiskSpacePercentInUse) AS DiskSpacePercentInUse,
	MAX(bat.BatchRequestsSec) as BatchRequestsSec,
	MAX(ps.PageSplitSec) AS PageSplitSec,
	MAX(fs.FullScansSec) AS FullScansSec,
	MAX(comp.SqlCompilationsSec) AS SqlCompilationsSec,
	MAX(rcomp.SqlReCompilationsSec) AS SqlReCompilationsSec
FROM Analysis.PerfLocation L WITH(NOLOCK) CROSS JOIN  dbo.TimeTens t WITH(NOLOCK)
LEFT JOIN [Analysis].[pcv_CpuUsagePercent_10] cpu ON L.LocationID = cpu.LocationID and L.ClusterID = cpu.ClusterID and cpu.DateKey = 20221101 and t.Time6 = cpu.Timekey
LEFT JOIN [Analysis].[pcv_SignalWaits_10] sig ON L.LocationID = sig.LocationID and L.ClusterID = sig.ClusterID and sig.DateKey = 20221101 and t.Time6 = sig.Timekey
LEFT JOIN  [Analysis].[pcv_IoDiskLatencyTotal_10] lat ON L.LocationID = lat.LocationID and L.ClusterID = lat.ClusterID and lat.DateKey = 20221101 and t.Time6 = lat.Timekey
LEFT JOIN  [Analysis].[pcv_MemoryInstUsage_10] mem  ON L.LocationID = mem.LocationID and L.ClusterID = mem.ClusterID and mem.DateKey = 20221101 and t.Time6 = mem.Timekey
LEFT JOIN [Analysis].[pcv_DiskUsage_10] du ON L.LocationID = du.LocationID and L.ClusterID = du.ClusterID and du.DateKey = 20221101 and t.Time6 = du.Timekey -- Only for overview chart uses 60 days
LEFT JOIN  [Analysis].[pcv_BatchRequestsSec_10] bat ON L.LocationID = bat.LocationID and L.ClusterID = bat.ClusterID and bat.DateKey = 20221101 and t.Time6 = bat.Timekey
LEFT JOIN [Analysis].[pcv_PageSpiltsSec_10] ps ON L.LocationID = ps.LocationID and L.ClusterID = ps.ClusterID and ps.DateKey = 20221101 and t.Time6 = ps.Timekey
LEFT JOIN  [Analysis].[pcv_FullScansSec_10] fs ON L.LocationID = fs.LocationID and L.ClusterID = fs.ClusterID and fs.DateKey = 20221101 and t.Time6 = fs.Timekey
LEFT JOIN [Analysis].[pcv_SqlCompilationsSec_10] comp  ON L.LocationID = comp.LocationID and L.ClusterID = comp.ClusterID and comp.DateKey = 20221101 and t.Time6 = comp.Timekey
LEFT JOIN [Analysis].[pcv_SqlReCompilationsSec_10] rcomp  ON L.LocationID = rcomp.LocationID and L.ClusterID = rcomp.ClusterID and rcomp.DateKey = 20221101 and t.Time6 = rcomp.Timekey
WHERE L.IsActive = 1 and L.ServerID = 1
	and  CONVERT(TIME, t.dtTime) <  CONVERT(TIME, getutcdate())
GROUP BY L.LocationID, L.ClusterID,  L.ClusterName, t.Time4s;
GO
USE [ServerAnalysisDW]
GO


CREATE PROCEDURE [Analysis].[PerfCounter_Bi_ServerProperties]
AS
BEGIN

DECLARE @id as TABLE (ID int identity(1,1), LocationID int, ClusterID int, ClusterName varchar(150))
DECLARE @d as TABLE (	ID int identity(1,1),
			LocationID int,
			ClusterID int,
			LocationName varchar(250),
			ClusterName varchar(250),
			ClusterFullName varchar(250),
			Property varchar(250),
			DataVal varchar(250))
DECLARE @iLoopP INT;
DECLARE @cLocationID INT;
DECLARE @cClusterID INT;
DECLARE @cLocationName varchar(250);
DECLARE @cClusterName varchar(250);
DECLARE @cClusterFullName varchar(250);

INSERT INTO @Id (LocationID, ClusterID, ClusterName)
SELECT LocationID, ClusterID, ClusterName
FROM Analysis.PerfLocation
WHERE IsActive = 1 and ServerID = 1
ORDER BY LocationID DESC, ClusterID DESC;

SELECT @iLoopP = MAX(ID) FROM @id;

WHILE @iLoopP > 0
BEGIN

	SELECT	@cLocationID = LocationID,
		@cClusterID = ClusterID,
		@cLocationName = (CASE LocationID
				WHEN 101123 THEN 'MyCompany-US'
				WHEN 201123 THEN 'MyCompany-QA'
				WHEN 301123 THEN 'MyCompany DEV'
				ELSE 'Undefined' END),
		@cClusterName = ClusterName,
		@cClusterFullName = CONCAT(ClusterName,' (',
					(CASE LocationID
				WHEN 101123 THEN 'MyCompany-US'
				WHEN 201123 THEN 'MyCompany-QA'
				WHEN 301123 THEN 'MyCompany DEV'
				ELSE 'Undefined' END)    ,')')
	FROM @id
	WHERE ID = @iLoopP;

	INSERT INTO @d (Property, DataVal)
	EXEC [Analysis].[PerfCounter_Rpt_Server_Properties]  @cLocationID, @cClusterID;

	UPDATE @d
	SET LocationID = @cLocationID,
		ClusterID = @cClusterID,
		LocationName = @cLocationName,
		ClusterName = @cClusterName,
		ClusterFullName = @cClusterFullName
	WHERE LocationID IS NULL;

	SELECT	@cLocationID = 0,
		@cClusterID = 0,
		@cLocationName = '',
		@cClusterName = '',
		@cClusterFullName = '',
		@iLoopP = @iLoopP-1
END;

SELECT * FROM @d ORDER BY LocationID, ClusterID;

END
GO
USE [ServerAnalysisDW]
GO

CREATE PROCEDURE [Analysis].[PerfCounter_Bi_DatabaseProperties]
AS
BEGIN

DECLARE @id as TABLE (ID int identity(1,1), LocationID int, ClusterID int, ClusterName varchar(150))
DECLARE @dB as TABLE (	ID int identity(1,1),
			LocationID int,
			ClusterID int,
			LocationName varchar(250),
			ClusterName varchar(250),
			ClusterFullName varchar(250),
			DatabaseName varchar(150),
			MdfFileName varchar(150),
			MdfMBs varchar(24),
			LdfMBs varchar(24),
			IOpcnt varchar(8),
			Model varchar(12),  --  1 = FULL, 2 = BULK_LOGGED, 3 = SIMPLE
			SqlVersion varchar(8),  -- 70,80,90.100,110,20,130, 140, 150
			DbState varchar(20),  -- 0 = ONLINE, 1 = RESTORING, 2 = RECOVERING, 3 = RECOVERY_PENDING, 4 = SUSPECT, 5 = EMERGENC, 6 = OFFLINE, 7 = COPYING, 10 = OFFLINE_SECONDARY
			LastBackup varchar(24),
			DailyGrowth int);
DECLARE @iLoopP INT;
DECLARE @cLocationID INT;
DECLARE @cClusterID INT;
DECLARE @cLocationName varchar(250);
DECLARE @cClusterName varchar(250);
DECLARE @cClusterFullName varchar(250);

INSERT INTO @Id (LocationID, ClusterID, ClusterName)
SELECT LocationID, ClusterID, ClusterName
FROM Analysis.PerfLocation
WHERE IsActive = 1 and ServerID = 1
ORDER BY LocationID DESC, ClusterID DESC;

SELECT @iLoopP = MAX(ID) FROM @id;

WHILE @iLoopP > 0
BEGIN

	SELECT	@cLocationID = LocationID,
		@cClusterID = ClusterID,
		@cLocationName = (CASE LocationID
			WHEN 101123 THEN 'MyCompany-US'
			WHEN 201123 THEN 'MyCompany-QA'
			WHEN 301123 THEN 'MyCompany DEV'
			ELSE 'Undefined' END),
		@cClusterName = ClusterName,
		@cClusterFullName = CONCAT(ClusterName,' (',
			(CASE LocationID
			WHEN 101123 THEN 'MyCompany-US'
			WHEN 201123 THEN 'MyCompany-QA'
			WHEN 301123 THEN 'MyCompany DEV'
			ELSE 'Undefined' END)    ,')')
	FROM @id
	WHERE ID = @iLoopP;

	INSERT INTO @dB (DatabaseName,MdfFileName,MdfMBs,LdfMBs,IOpcnt,Model,SqlVersion,DbState,LastBackup,DailyGrowth)
	EXEC [Analysis].[PerfCounter_Rpt_Database_Properties]  @cLocationID, @cClusterID;

	UPDATE @dB
	SET LocationID = @cLocationID,
		ClusterID = @cClusterID,
		LocationName = @cLocationName,
		ClusterName = @cClusterName,
		ClusterFullName = @cClusterFullName
	WHERE LocationID IS NULL;

	SELECT	@cLocationID = 0,
		@cClusterID = 0,
		@cLocationName = '',
		@cClusterName = '',
		@cClusterFullName = '',
		@iLoopP = @iLoopP-1
END;

SELECT * FROM @dB ORDER BY LocationID, ClusterID;

END
GO
Now that I have the new objects created I will create five datasets for my Power BI project:
SELECT * FROM [Analysis].[InstanceList]  -- table

SELECT * FROM [Analysis].[pcv_bi_overview_today] -- view

EXEC [Analysis].[PerfCounter_Rpt_Overview]  -- procedure

EXEC [Analysis].[PerfCounter_Bi_ServerProperties]  -- procedure

EXEC [Analysis].[PerfCounter_Bi_DatabaseProperties]  -- procedure
Data Model
My data model is shaping up like this:
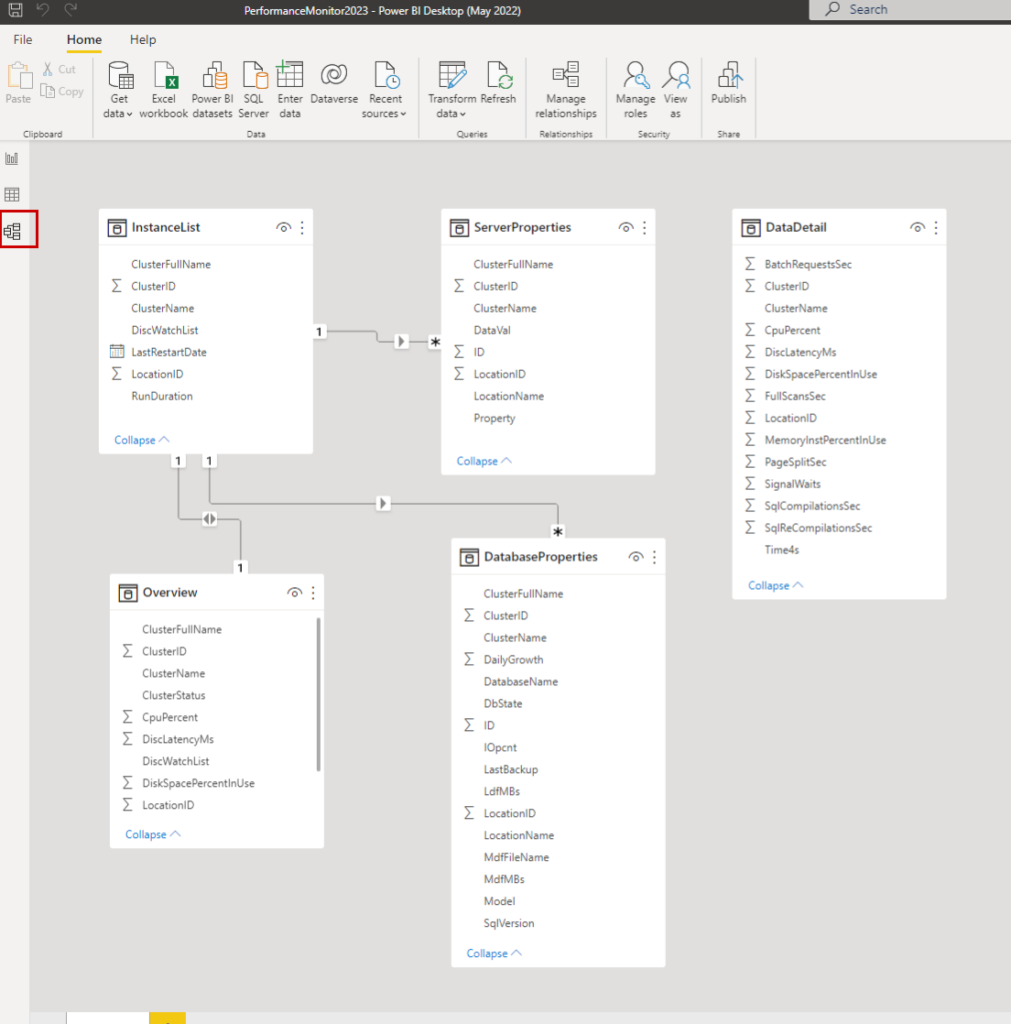
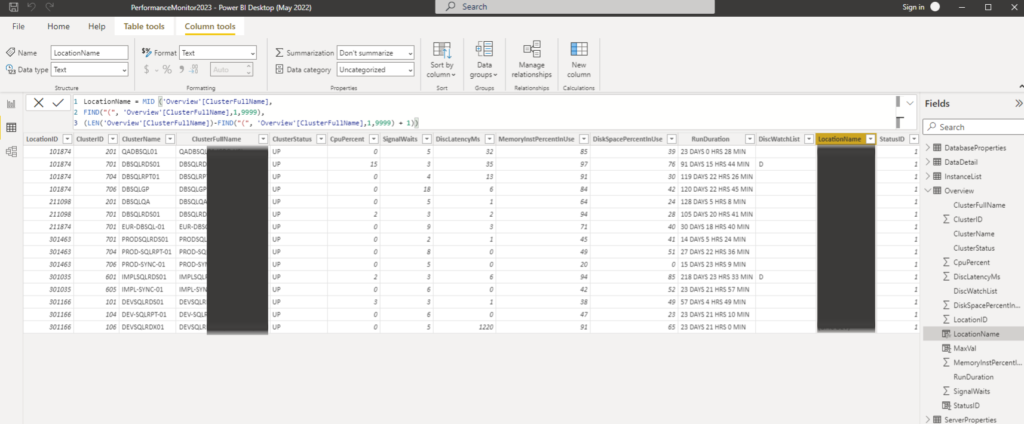
I will add a couple custom columns to some of my model tables next.
For the DataDetail table and the Overview table, I will add a MAXVAL column.
MaxVal = 100For the Overview table, I will add columns for LOCATIONNAME and STATUSID.
LocationName = MID('Overview'[ClusterFullName],
FIND("(", 'Overview'[ClusterFullName],1,9999),
(LEN('Overview'[ClusterFullName])-FIND("(", 'Overview'[ClusterFullName],1,9999) + 1))


StatusID = IF ( 'Overview'[ClusterStatus] = "UP", 1, 0 )
LAYOUT MODE
I will create three pages: OVERVIEW, INSTANCE and DATABASE. Only OVERVIEW will be visible. The other two are defined as hidden and will be used as drill-through pages from the Overview.
First I add a MATRIX to my layout pane and configure that for the OVERVIEW data.
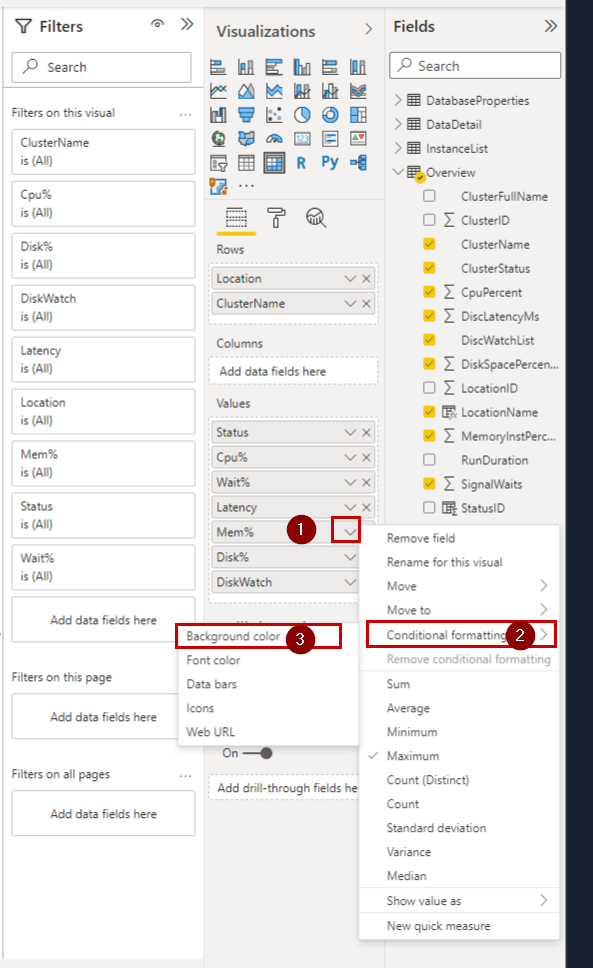
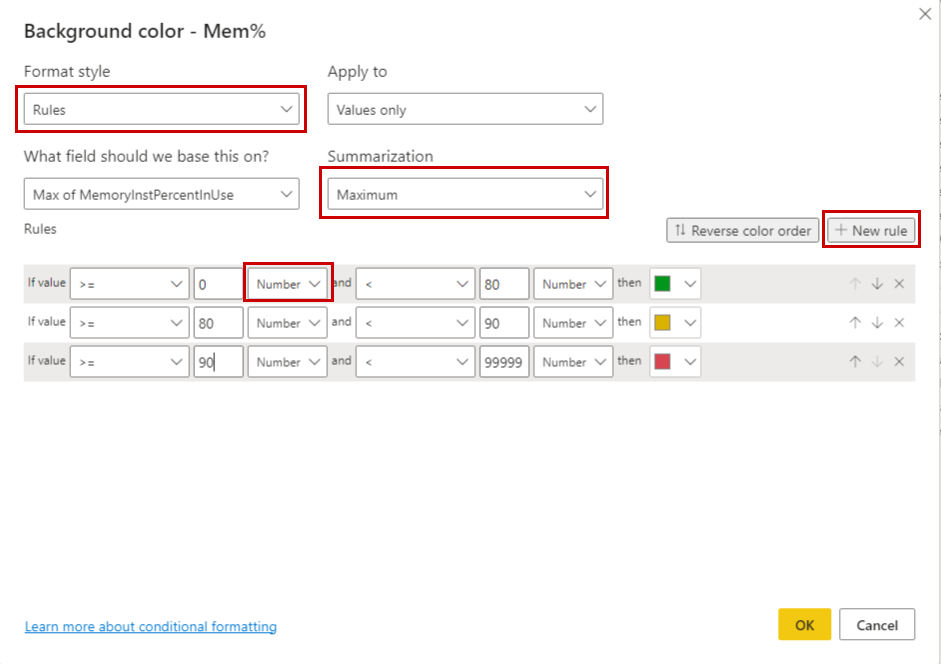
In the VISUALIZATIONS column of the interface, I can configure the values to change color be clicking the carrot next to the data item and then CONDITIONAL FORMATTING the BACKGROUND COLOR.
DRILL THROUGH PAGE(S)
Before the DRILL THROUGH OPTION appears on the overview page, I must first create the DRILL THROUGH page. This is what my INSTANCE page will look like.
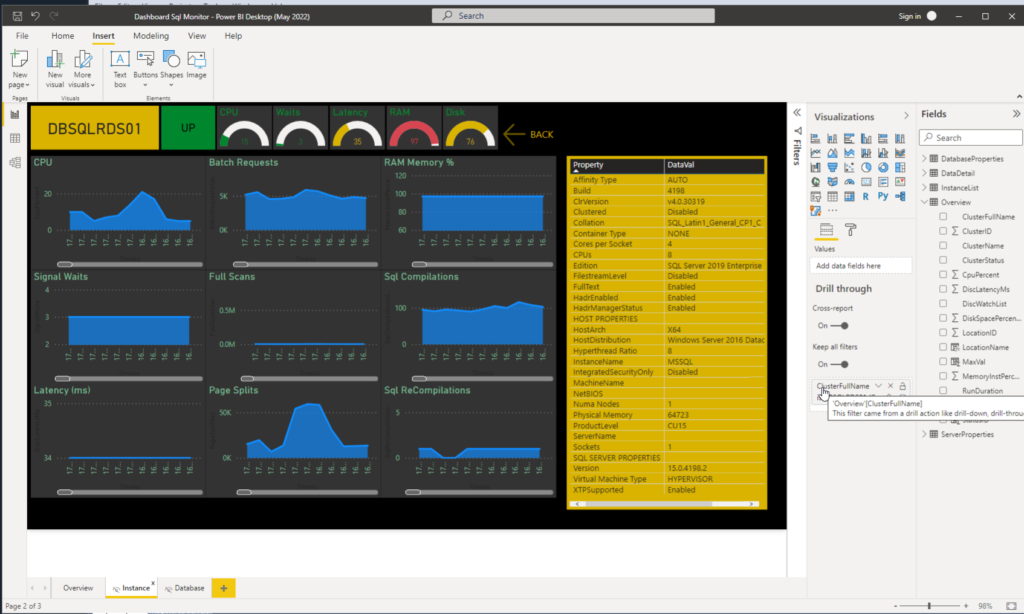
As soon as I drag and drop the “Overview” “ClusterFullName” column onto the page’s Drill-Through property, the link is made.
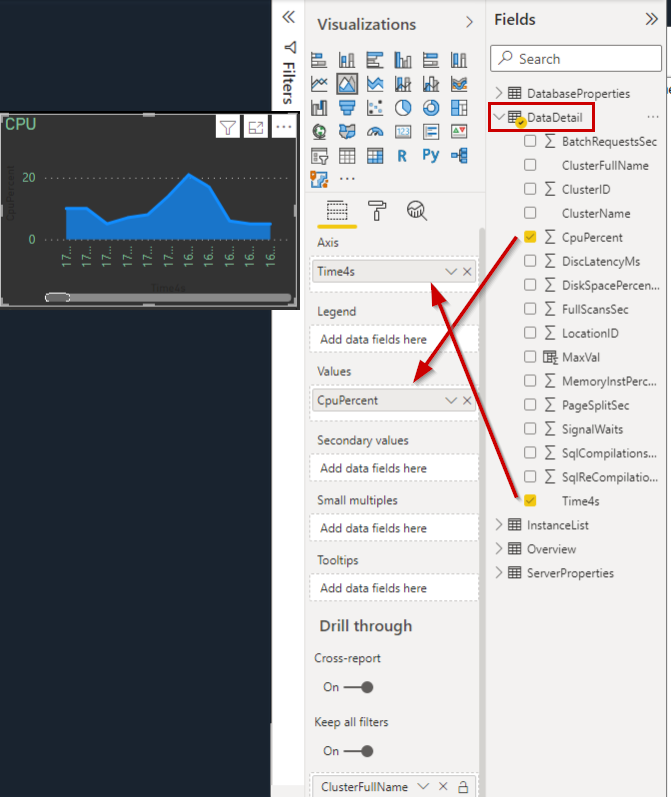
I have created each individual metric using the DataDetail table and an AREA CHART. Here is how I configured the CPU AREA CHART:
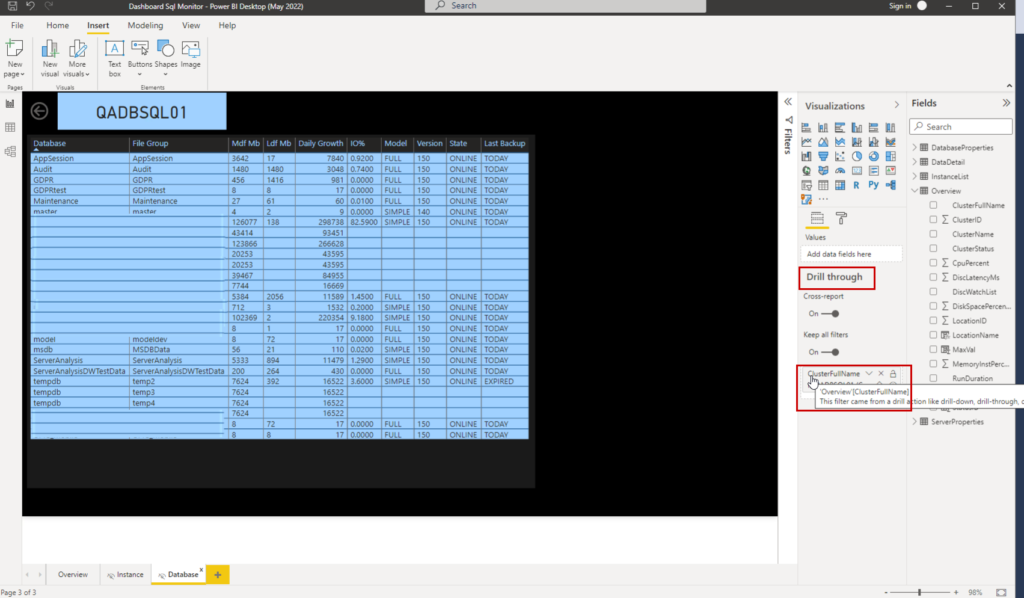
On the DATABASE DRILL THROUGH page, I added a table for displaying data.
MOBILE REPORT
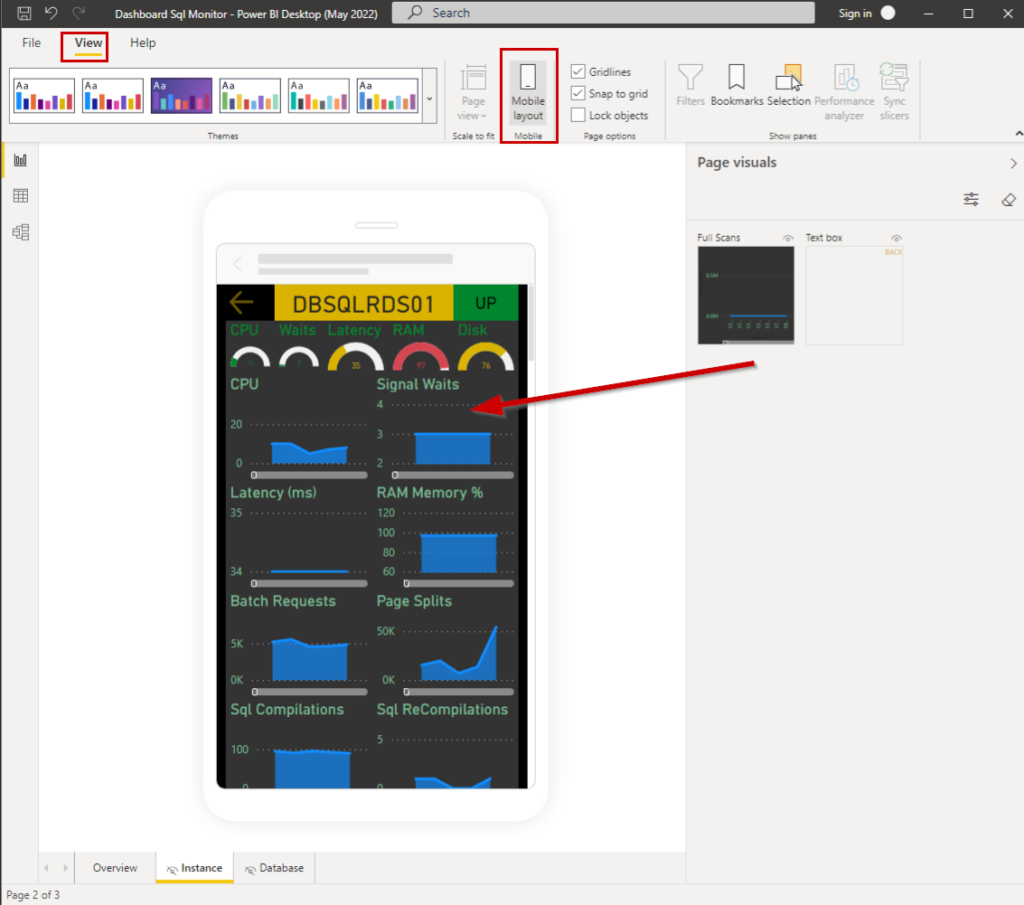
I use my mobile device to check on the health of the databases when I’m out and about. I’ve configured the mobile layouts to work with this as well. Adjusting the objects slightly different so they fit in a scroll fashion on the screen.
I’ll add the additional code to the GIT project for this new section as well.
https://github.com/LoveTheSql/SQL-Performance-Monitor-2022
Note: I’ve include a new table dbo.TimeTens in the code as well.